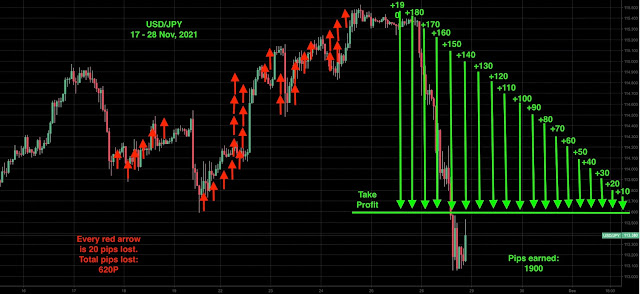
The graph below shows what happened to the USD/JPY rate between 17 and 28 November 2021. The red arrows are taken losses, the green arrows are gains. The strategy is the combination of linearly growing losses against exponentially growing profits.
 |
| USD/JPY 2021/11/17 - 2021/11/28 |
Why did I choose this strategy?
A quick look at the money supply data reveals that there is a huge difference in the way the monetary policies are run in the US and Japan. The M3 growth in both countries is shown on the chart below (2020/01/01 - 2021/09/01). During this time, the US money supply has grown over 3 times faster. As a result, we should have expected the appreciation of the yen in relation to the dollar.
This Is Why The Bitcoin Price Will Drop To Zero In A Long Run
 |
| 1. M3 Money Supply, US, Japan, 2020/01/01 = 100 |
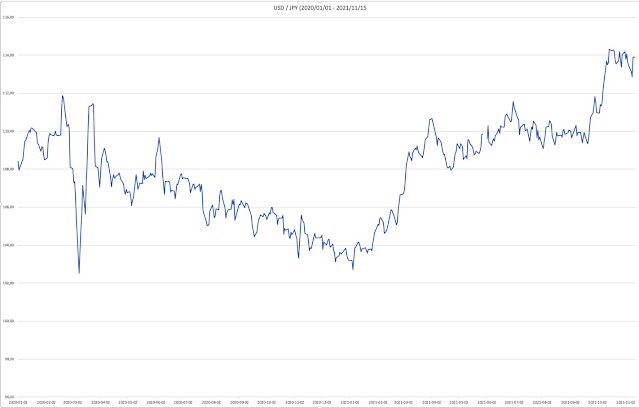
In fact, the USD/JPY rate has followed its fundamentals throughout 2020, but for some reason, all yen gains have been quickly erased after January 2021. The history of the USD/JPY rate between 2020/01/01 and 2021/11/15 is shown in chart 2. After reaching its lowest point on Jan 5, 2021, the chart started climbing steeply towards 115.
 |
| 2. USD / JPY (2020/01/01 - 2021/11/15) |
The USD/JPY rate has grown 5% since January 2020 and 11% since January 2021. No fundamentals can explain this spike, which happened despite the 25-percentage-point higher US M3 growth. The US year-on-year GDP growth is 4.9%, compared to 1.4% in Japan. A serious difference, but surely not big enough to trigger an 11% exchange rate movement in 2021. Japan has a lower unemployment rate (2.8% against 4.6% in the US), and a much lower inflation rate (0,2% against 6.2% in the US). In fact, on the basis of these fundamental data, we should have expected USD/JPY to dive 20%, not rise 5%.
The Euros Are Being Printed Faster Than Dollars Now
In other words, there is no way, the USD/JPY can continue its growth under the current macro economical conditions. The rate has not followed its fundamentals since January 2021 and this is exactly the kind of a situation, that forex traders should be looking for. The bubble is visible with the naked eye and should burst or at least start deflating soon.
How to short?
A basic element for a USD/JPY strategy should be finding an optimal entry for a "Big Short". Sadly, the strategy has to involve aggressive selling against the trend, which can lead to substantial losses. The trader can do two things. Allow losses to grow and set tight take-profits or set tight stop-losses and allow profits to grow. The first strategy is scalping for profits, the second is scalping for losses. Both strategies require different approaches to risk
While allowing losses to grow, you need to calculate your risk very carefully. Thankfully it is not a difficult calculation. The major disadvantage of this strategy is that your losses grow exponentially. In other words, you need to be very, very careful, and when in trouble - deleverage (take some losses along with profits always when you can afford it).
Another strategy - scalping for losses lets you avoid exponential growth of your losses. In this case, they grow linearly, which means you can afford more risk and trade larger lots, which in turn may bring higher profits. Exponentially growing profits can be taken after the chart changes its direction.
At Fx Underdog Project, so far we have picked the second option for our new USD/JPY fund.
Data Source:
Chart 1 Organization for Economic Co-operation and Development, M3 for the United States [MABMM301USM189S], retrieved from FRED, Federal Reserve Bank of St. Louis; https://fred.stlouisfed.org/series/MABMM301USM189S, November 16, 2021. Organization for Economic Co-operation and Development, M3 for Japan [MABMM301JPM189S], retrieved from FRED, Federal Reserve Bank of St. Louis; https://fred.stlouisfed.org/series/MABMM301JPM189S, November 16, 2021. https://fred.stlouisfed.org/series/WM2NS#0
Chart 2 Board of Governors of the Federal Reserve System (US), Japanese Yen to U.S. Dollar Spot Exchange Rate [DEXJPUS], retrieved from FRED, Federal Reserve Bank of St. Louis; https://fred.stlouisfed.org/series/DEXJPUS, November 15, 2021.
