We analyzed data for the period between 2010 and mid-2021 in order to verify if the crossings of daily SMA 50 and SMA 200 really can be treated as sales signals. Those, who follow me on Twitter or Facebook know, that I am not exactly a "price-action type". I am more into fundamentals and risk management, but most of all I am into unbiased data analysis. However, I have to admit that the results, trhat we received were quite encouraging.
If we bought EUR/USD every time SMA 50 crossed over SMA 200 and sold every time it did the opposite, we could make 3579 pips. It is not a lot over 11.5 years, but still, it is good to know the direction.
According to the Fx Underdog Project team, these data deserved some further analysis. First of all, it is important to notice, that trading SMA crosses is not as effective as it looks at the first sight.You have to remember, that you need to look at the actual chart, not at the crosses of SMAs themselves. The first chart will be a great example. What looked like a 1600 pip profit was in fact only 620. When you use SMA crosses, you have to agree on the simple fact, that entry and exit signals come too late.
On January 20, 2010, the EUR/USD daily SMA 50 crossed below the SMA 200, which was a major sell signal. The rate was at 1.4106 on this day and had already been in a falling trend for a week. The fall did not start immediately after the signal. First, the rate moved 100 pips up and then fell towards it minimum of 1.1876 on June 7th. Closing the short trade on this day would bring as much as 2230 pips, but this kind of decision would have never been made by a trend follower. The chart was still trending and the trend was even accelerating at that time.
 |
What looks like a 1600 profit is in fact just 620
|
The exit/buy signal came only on September 26th, after the rate had climbed as high as 1.3486. After closing the trade at this point, the traders could earn 620 pips. The buy signal from September 26th was also very late. Not only 1000 pips from the previous short trade were lost, but also the next long trade did not bring any profits.
When the sell signal came on January 16, 2011, the rate was already 102 pips below the previous buy signal. Although it had climbed to 1.4282 on the way, it couldn't be closed without exit signal (another crossing of the SMAs). Again, the sharp fall has started when the long trade was open, and while the growth was still accelerating.
January 2011 has brought several crosses and re-crosses of the SMAs. The total outcome of the trades triggered by them was +1 pip. Another major buy signal came on the 26th of January, at the level of 1.3713. The trade, that was triggered by it, was again, unsuccessful, even if the signal was followed by one of the highest spikes in the history of EUR/USD trading. The rate has reached 1.4941 on May 4th but the closing signal (and another sales signal) came 4 months later, on September 11, 2011, at the level of 1.3587. As a result, the long trade from Jan 26 has brought the loss of 126 pips.
Selling EUR/USD on September 11, 2011 was a much better idea. It brought as much as 549 pips before another buy signal from October 5, 2012.
 |
| EUR/USD 2011 - 2012 |
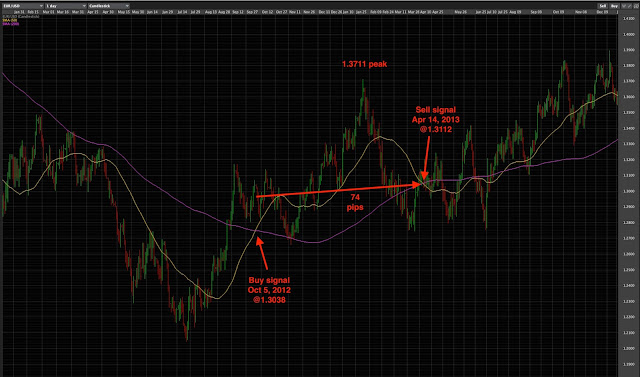
The buy signal from Oct 5, 2012 has triggered another transaction, which had the great potential, but again, the closing signal came too late. The Oct 5 buy signal came at 1.3038. At first the rate fell sharply over 300 pips to 1.2660 buy later climbed to 1.3711 on Feb 1, 2013. Closing the trade at this moment would have brought 673 pips but the close/buy signal came much later - on April 14, 2013. The trade could be closed at 1.3112 with the profit of just 74 pips.
 |
| EUR/USD 2012 / 2013 |
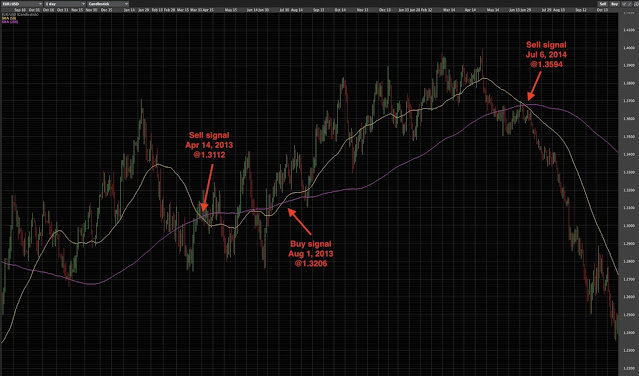
The April 14, 2013 triggered another trade that ended with a loss. Opening a short at 1.3112 and closing at 1.3206 on August 1, 2013 has brought -94 pips. Another trade - a long opened on August 1, 2013 has conpensated this loss. The closing signal came on July 6, 2014 at 1.3594. The trade brought the profit of 388 pips.
 |
| EUR/USD 2013 - 2014 |
Jul 6, 2014 sell signal has brought an extremely profitable trade. Selling for 1.3594 and closing on October 1, 2015 at 1.1194 left traders with a huge profit of 2400 pips. This trade confirms, that trading SMA crosses becomes very profitable when prices of a financial instruments are trending.
 |
| The +2400 pip trade from 2014 / 2015 |
Apparently everything has to balance in nature, as the following trades were a set of major disasters. The buy signal that came on October 1, 2015, triggered a very bad trade which lost 550 pips. Another trade, opened on March 22, 2016 was similar, and its result was -574 pips. Another loss was triggered by a sell signal received on October 25, 2016. This trade has brought the loss of 335 pips. Another buy signal from May 24 2017, was another disaster, bringing the loss of 337 pips.
 |
| A series of bad traders from 2015 - 2016 |
Finaly, the May 24, 2017 buy signal triggered a successful transaction. The result was +556 pips, another signal from Jun 6, 2018 resulted in a 557-pip profit, a simmilar result was brought by a June 25, 2020 buy signal (+554 pips).
 |
| The successful 2017 - 2020 trades |
The experiment has brought the total of 3579 pips. But also some other conclusions can be drawn.
1. When this trading strategy is used, the closing signals usually come too late and lead to the loss of the large part of profits.
2. The strategy is successful when the market is trending.
3. EUR/USD trends often reversed when they were still accelerating. According to our data it was very difficult to predict reversals.


