According to the classical theory of "technical analysis / price action", forex trends consist of, so-called, "stages". First, the trend develops (accelerates) and then gets exhausted (decelerates), and finally becomes ready for a reversal. You can see an example on the chart below. This rule is so obvious for the chartists, that probably no one ever checked if it is even true.
 |
| 1. An example of a EUR/USD trend |
To be honest, I do not like this example at all. First, it was extremely difficult to find. Such formations simply do not exist on EUR/USD charts. Besides, when you look at the second part of the chart (below the second arrow), you won't see the trend at all. It rather looks like a consolidation before the spike, which in turn leads to a correction.
USD/JPY Bubble Is Visible With The Naked Eye
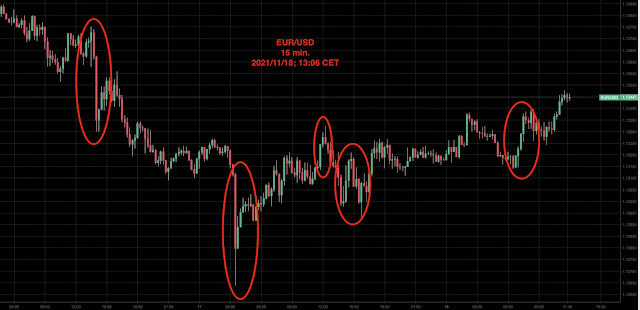
In fact, the EUR/USD reality is completely different from the theory. Most trends start reversing while they still accelerate. And plentiful examples can be found on any EUR/USD chart. Trend reversals do not follow decreased volatility periods, they follow volatility spikes.
 |
| 2. The EUR/USD trends' reversals after acceleration |
 |
| 3. More examples of EUR/USD reversals after volatility pickups |
Back To Home Page