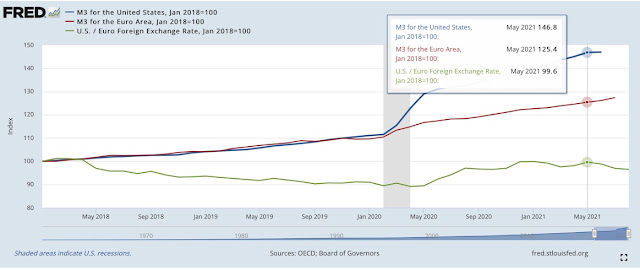
The amount of currency in an economy is one of the most important factors influencing its value. The chart below shows three variables. M3 money supply aggregates for the United States and Euro Area and EUR/USD exchange rate. January 1st, 2018 equals 100 for all 3 variables, this way it is easier to see relative changes.
 |
| EUR/USD exchange rate, US and Euro Area M3 aggregates |
The first and most obvious conclusion is that EUR/USD kept falling when both currencies were printed at a similar pace. This happened between January 2018 and February 2020. Probably other fundamental factors, like faster GDP growth, higher interest rates, and lower unemployment created a higher demand for the US currency. As the result, it soared in relation to the euro.
The chart clearly shows that EUR/USD could not grow until the US started adding the currency to its economy at a multiple faster pace than Euro Area. Between March and May 2020, the US M3 aggregate has increased by 11.6%. At the same time, the M3 growth in Eurozone was just 2.9%. The US printed its currency at a 4-times faster pace.
This theory was confirmed, when EUR/USD started falling in May 2021, right after the Euro Area began expanding its monetary base faster than the US.
Data for the recent weeks show, that both economies started expanding their M3s at a similar pace again. This means that EUR/USD bulls may begin to worry. We may expect a consolidation, or even more probably - further falls.
Data Shows - Interest Rates In The US And The Eurozone May Be Irrelevant To EUR/USD Rate