The classical theory of "technical analysis / price action" says that in order to make money, you need to follow trends. And the worst thing you can do is trade against the trend. Our team has analyzed some real data in order to check this assumption.
According to the widely accepted theory, the stronger the trend is, the stronger influence it has on the future movements of a financial instrument. The most popular method of measuring the trends is moving averages. If the current value of a financial instrument is over the moving average, it means it's trending up. If it's below, the chart is trending down.
We have checked daily EUR/USD data for the period between June 1, and September 21, 2021.
The chart below shows the position of each day's closing EUR/USD rate in relation to the 5-period simple moving average (x-axis) and the next day's movement that was corresponding to this position (the y-axis). According to everything, the trend followers believe in, the further the data point is from zero on the x-axis, the further from zero it should be on the y axis. The chart should show a cloud of data points ranging from lower-left to upper-right corner. The upper-left or lower-right should remain empty (except for some very unlikely random events).
 |
| Trend strength (SMA5) vs next day EUR/USD change |
The data shown on the chart show a very weak positive correlation. The correlation coefficient (the most popular measure of correlation) is on the level of 0,0245. There is also another measure, displayed in the right-upper corner. The R2 (R squared) shows in what part the next day change is explained by the trend strength. Perfectly, in case of strong correlation, the number should be close to 1, sadly in this case it's 0,0006. No correlation between the trend and the next day rate change can be seen with the naked eye.
Another two charts show how trend strength measured by SMA 10 and SMA 15 is correlated to the next-day movements of the EUR/USD rate. In both cases, we found even lower correlations. For SMA 10 there is a correlation coefficient of -0.0053 and R2 of 0,00003, for SMA 15 we have received CC of -0.0476 and R2 of 0.0023.
 |
| Trend strength (SMA10) vs next day EUR/USD change |
 |
| Trend strength (SMA15) vs next day EUR/USD change |
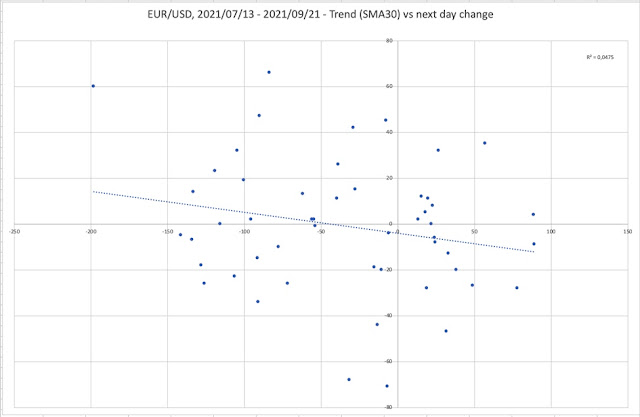
The analysis of trend strength measured by SMA 30 against the next-day change has revealed some good and some bad news. The good news is that we found some correlation. The CC value was -0.2175 and the R2 was 0.0475.
 |
| Trend strength (SMA30) vs next day EUR/USD change |
This is not a strong correlation but at least it is there. But this good news is even worse for trend followers because the correlation that we found was negative. The more the chart is trending, the more likely it is to revert.
In fact, our experiment has proven that the whole idea of following trends is either completely wrong or at best, completely irrelevant to trading reality.
