The accumulation/distribution index is a measure that uses price level and trade volume in order to assess whether the financial instrument is being accumulated or distributed by investors. The indicator is supposed to "confirm" trends. The trend is confirmed, when the indicator is moving in the same direction as the price on the chart. In case the trend direction is different from the A/D index movement, a trend reversal is more probable.
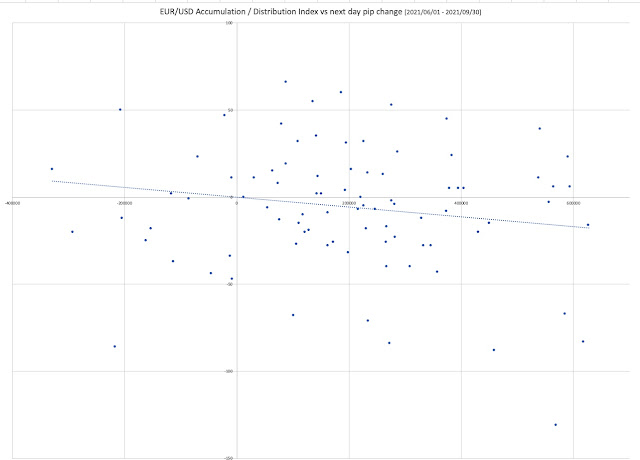
It seems the indicator itself shows some unexpected correlation with EUR/USD next day pip changes. The data for the period between 2021/06/01 and 2021/09/30 are shown on the chart below. The -13% correlation coefficient is more than I would expect from any trend indicator. Please note, that the observed correlation is negative (other than expected). The higher the AD index - the larger the next day drop.
 |
| 1. EUR/USD Accumulation / Distribution Index vs the next day pip change (2021/06/01 - 2021/09/30) |
However, this is not the way, we are supposed to look at the A/D indicator. What we really need to check is what happened when the trend has been confirmed by the indicator, and what happened when it was not.
 |
2. EUR/USD Accumulation / Distribution Index Change vs EUR/USD Trend (Over or below SMA5) [2021/06/09 - 2021/09/30] |
Chart no 2 presents exactly what we want to check - trend strength and A/D index change.
The data points in the upper left quarter represent the situation in which the trend was positive and the A/D change was negative. This means an unsupported positive trend. If using the A/D indicator in an intended way makes sense, we should expect an increased probability of reversal (or negative average next-day values). And indeed, this happened. The sum of next-day changes for all 13 trades were -65 pips (or on average, exactly 5 pips per trade).
The EUR/USD Bearish Trend Is Likely To Continue
The upper right quarter are situations when the positive trend has been confirmed by the A/D indicator. We should expect positive sum of next-day changes. In this case, the total outcome of 17 trades was -45 pips (or -2.65 pips per trade). The strategy did not work as expected.
The lower left quarter of the chart are situations when the A/D changes support the negative trend. In this case, the total outcome of 28 trades was -122 pips (we would earn 4.35 pips per trade).
The last - fourth quarter are situations when a negative trend is not confirmed. The total outcome of 24 trades is -354 pips, which blows the whole strategy for good.
The total outcome of the experiment was -212 pips, which in fact is not bad news at all. If you can find a strategy, that loses money consistently - reverse the strategy.
